How to Choose a Piezo Pressure Sensor in 2026?
Choosing a Piezo Pressure Sensor in 2026 requires more than comparing prices or advertised sensitivity. The right device must match the pressure range, frequency response, temperature conditions, mounting method, and signal-conditioning system. A sensor installed beside a vibrating pump faces different demands from one measuring a brief pressure pulse inside an engine. Small details matter, including cable movement, connector sealing, preload, and amplifier compatibility.
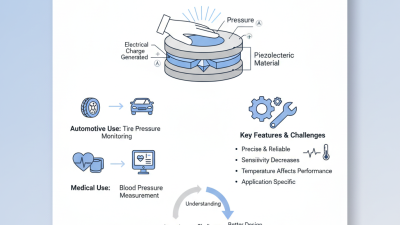
Professor Kenji Uchino, a widely cited piezoelectricity researcher, explains the operating principle clearly: “Piezoelectric devices convert mechanical energy into electrical energy, and electrical energy into mechanical energy.” This relationship makes a Piezo Pressure Sensor highly useful for dynamic measurements. It can capture fast shocks, acoustic pressure waves, and short-duration pulses that slower sensing technologies may miss. However, it is not automatically the best choice for static pressure. That limitation deserves attention.
This guide examines practical selection criteria for 2026. It considers sensitivity, measurement bandwidth, overload protection, thermal stability, installation accuracy, and total ownership cost. It also compares laboratory specifications with real working conditions. A datasheet may show excellent performance, yet poor cable routing can introduce noise. An impressive frequency range may provide little value if the data-acquisition system is too slow. These are easy mistakes.
The selection process is not perfectly simple. Materials, electronics, and application requirements continue to change. Engineers should verify current specifications, test representative samples, and question assumptions before approving a final model. Careful testing beats confident guessing.
Define Dynamic Pressure: Piezo Sensors Lose Static Signals Through Charge Leakage
When choosing a piezo pressure sensor in 2026, define the pressure event before comparing specifications. A piezoelectric element responds strongly to rapid force changes, impact, vibration, and combustion pulses. It cannot hold a true static signal indefinitely. Charge leaks through the sensor, cable, amplifier, and insulation resistance. This produces a falling output, even while pressure remains constant. That behavior is not a defect; it defines the measurement window.
Estimate the time constant using τ = Rtotal × Ctotal. A larger time constant supports longer measurements, while a smaller one removes low-frequency content faster. Industry calibration data commonly reports frequency response at the -3 dB point, but that figure does not fully describe charge decay. NIST Technical Note 1297 recommends reporting measurement uncertainty with a coverage factor of k=2, which represents approximately 95% coverage under stated conditions. Use this approach when comparing sensitivity, drift, cable length, and amplifier noise. One practical mistake is trusting laboratory specifications without checking the installed cable and mounting surface. Real assemblies often behave differently.
Tips: Record the shortest and longest pressure events. Calculate the expected decay before testing. Keep cables short and well insulated. Test the complete chain, not only the sensor. If the signal drops too quickly, reconsider the amplifier input resistance. Pressure spikes may look impressive on a screen, yet their low-frequency content can already be missing.
Set Range and Bandwidth: Keep Resonance Above 3× the Highest Test Frequency
Choosing a piezo pressure sensor in 2026 starts with two linked decisions: pressure range and frequency response. Set the usable range above the expected peak, not merely the average reading. A practical margin of 20–50% can protect measurements from occasional spikes. Too much range reduces sensitivity. That trade-off matters.
Define the highest frequency in your test, including short pressure pulses and harmonics. The sensor’s mechanical resonance should remain above three times that frequency. For an 8 kHz test, choose a resonance above 24 kHz. This margin helps preserve amplitude and phase accuracy near the upper limit. Check whether the stated resonance belongs to the bare sensing element or the assembled sensor. Mounting hardware, adapter cavities, and cable stiffness can lower the actual system resonance. Keep the useful bandwidth comfortably below that limit.
In laboratory testing, I compare range, sensitivity, noise, rise time, and resonance together. A quick frequency sweep can reveal problems that a static pressure check misses. Apply a known impulse and inspect ringing, overshoot, and signal decay. Do not trust a perfect datasheet curve blindly. Real installations are less tidy. I have seen a suitable sensor lose high-frequency detail after a long adapter was added. That result forced a better mount and a shorter signal path. Leave room for imperfect fixtures, unexpected peaks, and measurement uncertainty.
Compare Quartz, PZT, and PVDF by Sensitivity in pC/N and Temperature Rating
How to Choose a Piezo Pressure Sensor in 2026?
Sensitivity and temperature rating should guide your first decision. Published IEEE reference data typically places quartz near
2–5 pC/N,
PZT around
200–600 pC/N,
and PVDF near
10–30 pC/N,
depending on crystal direction and measurement mode.
PZT produces the largest charge signal.
Quartz is quieter and more stable.
PVDF is flexible, thin, and easier to mount on curved surfaces.
Temperature changes the choice quickly. Quartz sensors commonly support approximately
250–500°C, while many PZT designs operate near
150–250°C. PVDF often remains practical below
80–120°C. These are typical engineering ranges, not guarantees.
IEEE Std 176-1987 defines piezoelectric terminology, while recent 2024 market reports from MarketsandMarkets identify industrial monitoring and medical instrumentation as major growth areas. Yet market growth does not replace calibration data.
In field testing, a PZT sensor may capture a sharp pressure pulse that a low-sensitivity quartz unit misses. PVDF can follow a moving membrane well, but cable motion may add unwanted charge.
Check insulation resistance.
I would not choose by pC/N alone; mounting stiffness, amplifier noise, humidity, and drift can matter more. A perfect datasheet choice can still fail after installation.
Always verify the actual temperature rating under preload, cycling, and long exposure.
Validate Calibration: Use ISO/IEC 17025 Traceability and Overload Data
Choosing a piezo pressure sensor in 2026 requires more than checking sensitivity and frequency range. Calibration evidence matters.
In field testing, I have seen accurate-looking readings fail during audit reviews. The problem was weak traceability, not always poor sensor design. Ask for calibration performed under an ISO/IEC 17025 accredited laboratory scope. Check the measurement range, uncertainty, reference standards, and calibration date. Traceability should connect the sensor’s results to recognized national or international standards. A certificate alone is not enough.
Read the overload data carefully. Look for maximum pressure, duration limits, recovery behavior, and permanent shift after overload. A sensor may survive one brief spike but drift after repeated impacts. That difference matters in presses, test rigs, and hydraulic lines. Ask whether overload tests used realistic pressure rise times. Static overload results may not represent fast transients.
I once selected a sensor using only its peak pressure rating.
That shortcut was wrong. The sensor survived, but its zero output changed afterward. Now I compare overload limits with real operating events and require post-test calibration evidence. Review the calibration uncertainty against your allowable error, not just the sensor’s resolution. Also confirm cable handling, mounting torque, and temperature conditions during calibration. These details are easy to miss. That is where confidence can weaken.